

Sector figures
The worldwide leadership
In the 90’s Spain reached the top and became the worldwide leader in the ceramic frits, colours and glazes sector. The efforts dedicated to R+D+I (Research + Development + innovation) and the competitiveness of the companies drove Spain to lead the market above Italy, former pioneers of this sector and, right now, mostly provided by the Spanish producers.
During the last 20 years the Spanish industry has continued in the development of new products. Great innovations have been held such as ceramic inks, which can be applied over ceramic tiles thanks to an ink-jet coloring system, similar to paper printers, but specifically designed for ceramic surfaces.
Bet for R+D+i
The frit industries bet hard for Innovation and invest a great part of their resources in Investigation and Development. A large % of their employees have a University Degree, providing therefore an important specialization. The quality and competitiveness of the products has been one important key for the spectacular growth of the ceramic industry in our country. The synergy between tile industries and ceramic frits, glazes and colours producers in a single front has catapulted the Spanish ceramic industry to the highest international peaks.
The international expansion
The Spanish frit industry has bet for the international diversification and expansion since the very beginning. Spanish companies have subsidiaries in Italy, Brazil, Indonesia, China, Mexico, India, Morocco, etc.
An exporting sector
Besides the promotion of the national tile industry, the sector exports more than 70% of the production. The main receptors are Italy, China, Egypt, Algeria, Russia, Morocco, India, Turkey, Emirates, Morocco, Germany, Poland, Russia, Brazil, etc
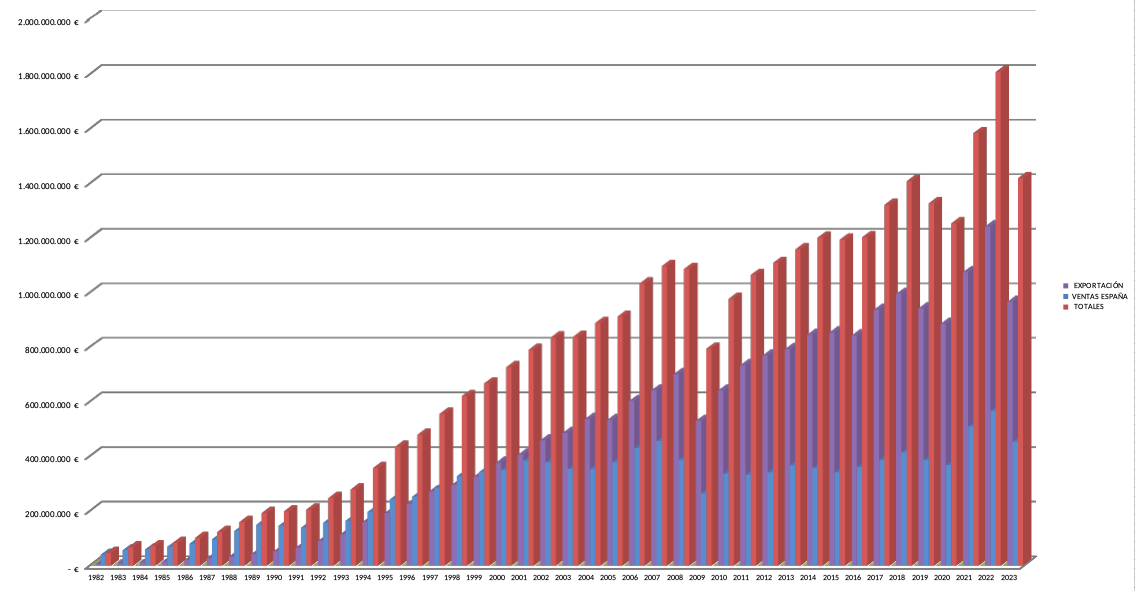
CERAMIC FRITS, GLAZES AND PIGMENTS SALES SECTOR
| AÑO | EXPORTACIÓN | VENTAS ESPAÑA | TOTALES |
|---|---|---|---|
| 1982 | 6.412.799 € | 39.738.920 € | 46.151.719 € |
| 1983 | 10.583.823 € | 56.723.522 € | 67.307.345 € |
| 1984 | 12.032.262 € | 59.205.702 € | 71.237.964 € |
| 1985 | 13.955.501 € | 68.677.653 € | 82.633.154 € |
| 1986 | 20.097.844 € | 80.776.026 € | 100.873.870 € |
| 1987 | 26.745.038 € | 96.462.442 € | 123.207.480 € |
| 1988 | 33.055.665 € | 126.813.554 € | 159.869.219 € |
| 1989 | 42.070.847 € | 150.253.026 € | 192.323.873 € |
| 1990 | 51.687.040 € | 146.646.953 € | 198.333.993 € |
| 1991 | 66.111.331 € | 138.833.796 € | 204.945.127 € |
| 1992 | 90.596.564 € | 157.134.614 € | 247.731.178 € |
| 1993 | 114.871.443 € | 163.817.869 € | 278.689.312 € |
| 1994 | 160.025.482 € | 196.711.261 € | 356.736.743 € |
| 1995 | 192.155.590 € | 242.508.384 € | 434.663.974 € |
| 1996 | 226.852.018 € | 252.407.053 € | 479.259.071 € |
| 1997 | 271.879.845 € | 283.852.006 € | 555.731.851 € |
| 1998 | 294.459.870 € | 326.499.825 € | 620.959.695 € |
| 1999 | 325.309.821 € | 341.771.543 € | 667.081.364 € |
| 2000 | 376.504.032 € | 349.656.822 € | 726.160.854 € |
| 2001 | 405.767.312 € | 383.505.823 € | 789.273.135 € |
| 2002 | 457.980.239 € | 377.921.221 € | 835.901.460 € |
| 2003 | 485.258.209 € | 353.187.153 € | 838.445.362 € |
| 2004 | 535.841.301 € | 353.195.870 € | 889.037.171 € |
| 2005 | 532.378.757 € | 379.354.912 € | 911.983.669 € |
| 2006 | 602.635.503 € | 430.503.364 € | 1.033.138.869 € |
| 2007 | 641.500.704 € | 456.047.030 € | 1.097.547.739 € |
| 2008 | 700.275.000 € | 387.334.000 € | 1.087.609.000 € |
| 2009 | 529.571.944 € | 264.457.368 € | 794.029.312 € |
| 2010 | 640.795.088 € | 336.190.176 € | 976.985.264 € |
| 2011 | 733.268.224 € | 332.462.360 € | 1.065.730.584 € |
| 2012 | 768.545.091 € | 340.814.609 € | 1.109.359.699 € |
| 2013 | 792.103.034 € | 367.213.045 € | 1.159.316.081 € |
| 2014 | 845.620.643 € | 356.537.085 € | 1.202.157.728 € |
| 2015 | 853.770.828 € | 341.015.928 € | 1.194.786.756 € |
| 2016 | 843.018.078 € | 360.211.589 € | 1.203.229.667 € |
| 2017 | 936.715.758 € | 385.521.166 € | 1.322.236.924 € |
| 2018 | 995.082.163 € | 413.699.904 € | 1.408.782.067 € |
| 2019 | 942.153.543 € | 385.681.732 € | 1.327.835.275 € |
| 2020 | 885.658.767 € | 368.011.705 € | 1.253.670.472 € |
| 2021 | 1.075.528.206 € | 509.084.206 € | 1.584.612.412 € |
| 2022 | 1.243.395.164 € | 565.277.533 € | 1.808.672.697 € |
| 2023 | 966.580.330 € | 452.742.152 € | 1.419.322.482 € |
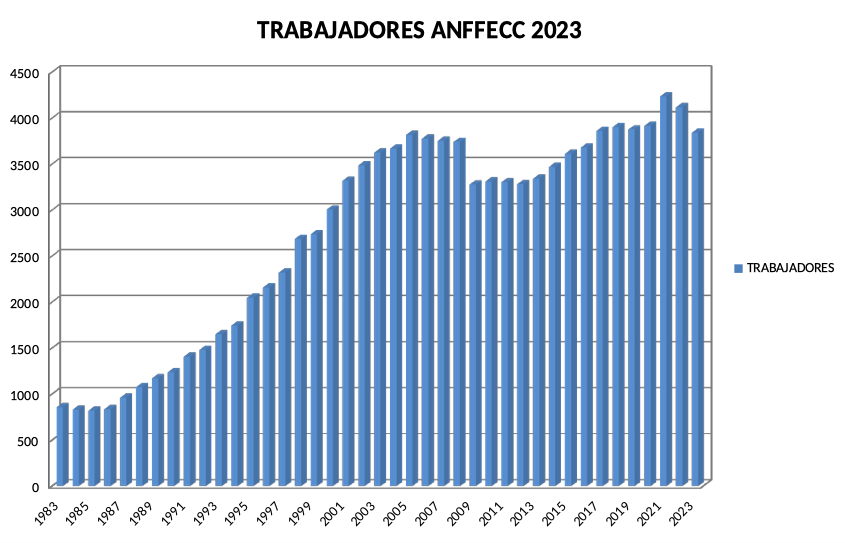
CERAMIC FRITS, GLAZES AND PIGMENTS WORKERS SECTOR
| AÑO | TRABAJADORES |
|---|---|
| 1982 | 874 |
| 1983 | 857 |
| 1984 | 828 |
| 1985 | 820 |
| 1986 | 836 |
| 1987 | 961 |
| 1988 | 1.074 |
| 1989 | 1.169 |
| 1990 | 1.239 |
| 1991 | 1.405 |
| 1992 | 1.482 |
| 1993 | 1.650 |
| 1994 | 1.745 |
| 1995 | 2.049 |
| 1996 | 2.160 |
| 1997 | 2.321 |
| 1998 | 2.685 |
| 1999 | 2.737 |
| 2000 | 3.005 |
| 2001 | 3.319 |
| 2002 | 3.487 |
| 2003 | 3.626 |
| 2004 | 3.669 |
| 2005 | 3.818 |
| 2006 | 3.776 |
| 2007 | 3.754 |
| 2008 | 3.741 |
| 2009 | 3.278 |
| 2010 | 3.310 |
| 2011 | 3.302 |
| 2012 | 3.279 |
| 2013 | 3.342 |
| 2014 | 3.470 |
| 2015 | 3.610 |
| 2016 | 3.680 |
| 2017 | 3.861 |
| 2018 | 3.900 |
| 2019 | 3.876 |
| 2020 | 3.915 |
| 2021 | 4.236 |
| 2022 | 4.118 |
| 2023 | 3.842 |
CERAMIC FRITS, GLAZES AND PIGMENTS STATISTICS SECTOR
| STATISTICS DATA | |
|---|---|
| TOTAL SALES 2023: | 1.419.322.482 € |
| TOTAL EXPORTS 2023: | 966.580.330 € |
| % OF EXPORTS OVER TOTAL: | 68,10 % |
| TOTAL DOMESTIC SALES 2023: | 452.742.152 € |
| % OF DOMESTIC SALES OVER TOTA: | 31,90 % |
| LABOUR FORCE 2023: | 3.842 |
| VARIATION OVER 2022: | |
| TOTAL SALES: | -21,53 % |
| EXPORTS: | -19,91 % |
| DOMESTIC SALES: | -22,26 % |
| LABOUR FORCE: | -6,70 % |
Address: C/ Enmedio, 116,1º Dcha.
12001 Castellón, Spain
Tel: (+34) 964 20 53 72
Email:
Copyright 2024 © Anffecc · All rights reserved · Legal notice